A Comparative Analysis of IPS Documentation Standards
Analysis Date: October 2026
Rubric Version: 1.3
1. Introduction
An Investment Policy Statement (IPS) is the governing document of an institutional investor. It defines the entity and the assets it covers, states the objectives the portfolio is meant to serve, sets the boundaries of risk, prescribes how the portfolio is built and kept in line, allocates decision authority, and fixes the cadence of oversight. For a public pension plan, which manages retirement assets under statutory fiduciary duties and answers to a legislature, a board, members and taxpayers at once, the IPS is the principal artefact by which governance is documented and can be defended.
This study examines the quality of IPS documentation across 122 U.S. public pension plans: statewide systems, teachers' and school-employee systems, county and municipal plans, and police and fire funds. Each document is scored on 14 domains of policy practice, grouped into six categories, and within every domain on four quality lenses. The scores measure the document, not the fund: they say how specific, enforceable and internally coherent the written policy is, and nothing about investment skill or returns.
Research Objectives
- Measure the overall quality of IPS documentation across a broad sample of public pension plans
- Locate the systematic strengths and weaknesses, by category and by quality lens
- Show what separates the strongest documents from the weakest
- Give plans an ordered set of improvements that the evidence supports
2. Methodology
2.1 Assessment Framework
The rubric (version 1.3) evaluates each IPS on 14 domains, grouped into six categories for comparison:
1. Governance & Oversight (2 domains) - Governance & Decision-Making - Monitoring, Reporting & Review
2. Objectives Clarity (3 domains) - Scope, Purpose & Coverage - Investment Objectives - Investment Philosophy (optional)
3. Risk Framework (3 domains) - Risk Tolerance & Risk Philosophy - Time Horizon & Constraints - Liquidity & Cash Flow Management
4. Portfolio Design (3 domains) - Strategic Asset Allocation - Rebalancing Policy - Spending / Distribution Policy
5. Implementation and Oversight (2 domains) - Implementation & Manager Oversight - Performance Measurement & Benchmarks
6. Responsible Investing/ESG (1 domain - optional; scored, but outside the headline number) - Responsible Investment / ESG
2.2 Scoring System
Each domain is scored on a five-point scale against written anchors:
- 5 (Best practice): fully specified, enforceable, aligned with peer practice
- 4 (Strong): clear and operational, with minor gaps
- 3 (Adequate): the basic structure is there, with notable gaps
- 2 (Weak): present but vague or non-operational
- 1 (Deficient): missing, or purely aspirational
Within each domain the judge scores four quality lenses - presence and clarity, quantification and enforceability, consistency and structure, and governance and process - and the domain score is the mean of the lenses that apply. A category score in this report is the mean of its domain scores.
The headline overall score of a plan is the figure the judge itself reports: the mean of its core domains. A domain is core when the rubric marks it mandatory, or marks it conditional and the condition applies. For a public pension plan that is 12 of the rubric's 15 domains. Investment Philosophy and Responsible Investment / ESG are optional: both are scored and shown throughout this report but excluded from the headline, and tax considerations is conditional on an institution type that does not apply here, so it is not scored at all. A critical gap is a core domain scored at 2 or below; an optional domain never raises one.
2.3 Scoring Procedure: The LLM Judge
Scores are produced by a large language model (Anthropic's Claude) acting as a structured judge against the rubric, not by manual review. The procedure is two-stage so that it is auditable and reproducible:
-
Extraction (retrieval). For each domain, a Claude model reads the whole IPS and extracts the relevant facts with verbatim evidence quotes and page references. It does not score. A faster, cheaper model (Claude Haiku) is used because the task is retrieval. The output is a frozen extraction that records the model, the rubric hash and a hash of the source text.
-
Judging (evaluation). A stronger model (Claude Sonnet) scores each domain against its anchors, lens by lens, from the frozen extraction and the source document. Scoring can therefore be re-run without re-extracting. The lens design is what lets the assessment separate "the policy is present" from "the policy is enforceable", the distinction at the centre of this report.
Several conventions keep the scores stable and traceable:
- Deterministic: the model runs at temperature zero, so the same input yields the same score.
- Structured output: the judge returns its verdict through a forced tool-use schema with enum-constrained reason codes, so every result is well-formed and tied to a stated reason.
- Evidence-checked: every quote the judge cites is verified against the source text. The result is reported as a diagnostic; it does not gate the score.
- Provenance: each scorecard records the judge model, rubric version and prompt version, so the paper's claims are frozen to an exact configuration and can be regenerated.
Validation against an expert. Because the scores are model-produced, their credibility rests on measured agreement with a human expert. A stratified sample of plans is rated blind, per domain, against the full IPS text, with the judge's score hidden until each human rating is submitted. Agreement is reported as a quadratic-weighted Cohen's kappa alongside per-domain error, bias and a test-retest ceiling. The sample and ratings are durable artefacts pinned to a judge configuration and double as a regression benchmark whenever the prompt or model changes. The scope is measure and diagnose; the judge is not tuned to the ratings.
2.4 Sample Composition
The corpus holds the current published IPS of 123 plans, drawn from the two hundred U.S. public pension plans with the most assets and covering 49 states plus one federal district. 122 are scored here. The remaining one is tracked but withheld from scoring because the document its sponsor publishes in the place of an IPS is a different instrument - such as a statement of investment beliefs or a set of investment guidelines - and a score derived from it would describe the wrong document. Each of the scored plans is counted once: where one policy governs several plans, the corpus keeps one document. By plan type:
| Plan type | Plans |
|---|---|
| Statewide systems | 49 |
| Municipal systems | 20 |
| Teachers' systems | 16 |
| Police and fire systems | 16 |
| County systems | 14 |
| School-employee systems | 5 |
| University systems | 2 |
2.5 Reading the Numbers
Every statistic is given to two decimals in the tables. In the running text the same figures are rounded to one decimal, so a sentence reads as a summary and the table beside it as the record. Scores describe the written policy. A low score means the document does not commit the plan to something specific and testable; it does not mean the plan behaves badly, and a high score is no evidence of investment skill.
3. Summary of Results
3.1 Overall Performance
The mean overall score across the 122 plans is 3.7 on the five-point scale and the median 3.7: most documents sit between the Adequate and Strong anchors. The spread is wide. About 2.5 points separate the strongest document from the weakest, more than the distance between an Adequate and a Best-practice rating (Table 1).
Table 1: Overall score, all plans
| Statistic | Value |
|---|---|
| Plans scored | 122 |
| Mean | 3.65 |
| Median | 3.71 |
| Minimum | 1.99 |
| Maximum | 4.50 |
| Standard deviation | 0.42 |
One plan scores below the Weak anchor and is kept in every statistic.
3.2 Category Performance Overview
The six categories fall into a clear order (Table 2). Governance & Oversight leads at 4.4; Implementation and Oversight and Objectives Clarity follow in the high threes; Portfolio Design and Risk Framework sit near the Adequate anchor; Responsible Investing/ESG trails at 2.2, the only category whose median sits at the Weak anchor.
Table 2: Category scores, all plans
| Category | Mean | Median | Min | Max | Std dev | Plans at 4.0 or above | Plans at 2.0 or below |
|---|---|---|---|---|---|---|---|
| Governance & Oversight | 4.35 | 4.50 | 2.50 | 5.00 | 0.53 | 100 (82%) | 0 (0%) |
| Implementation and Oversight | 3.91 | 4.00 | 1.75 | 4.88 | 0.59 | 64 (52%) | 1 (1%) |
| Objectives Clarity | 3.82 | 3.83 | 2.69 | 4.67 | 0.37 | 43 (35%) | 0 (0%) |
| Portfolio Design | 3.37 | 3.42 | 1.25 | 4.42 | 0.50 | 11 (9%) | 2 (2%) |
| Risk Framework | 3.07 | 3.08 | 1.50 | 4.50 | 0.51 | 4 (3%) | 4 (3%) |
| Responsible Investing/ESG | 2.21 | 2.00 | 1.00 | 4.75 | 0.79 | 4 (3%) | 62 (51%) |
Figure 1: Category Performance Rankings
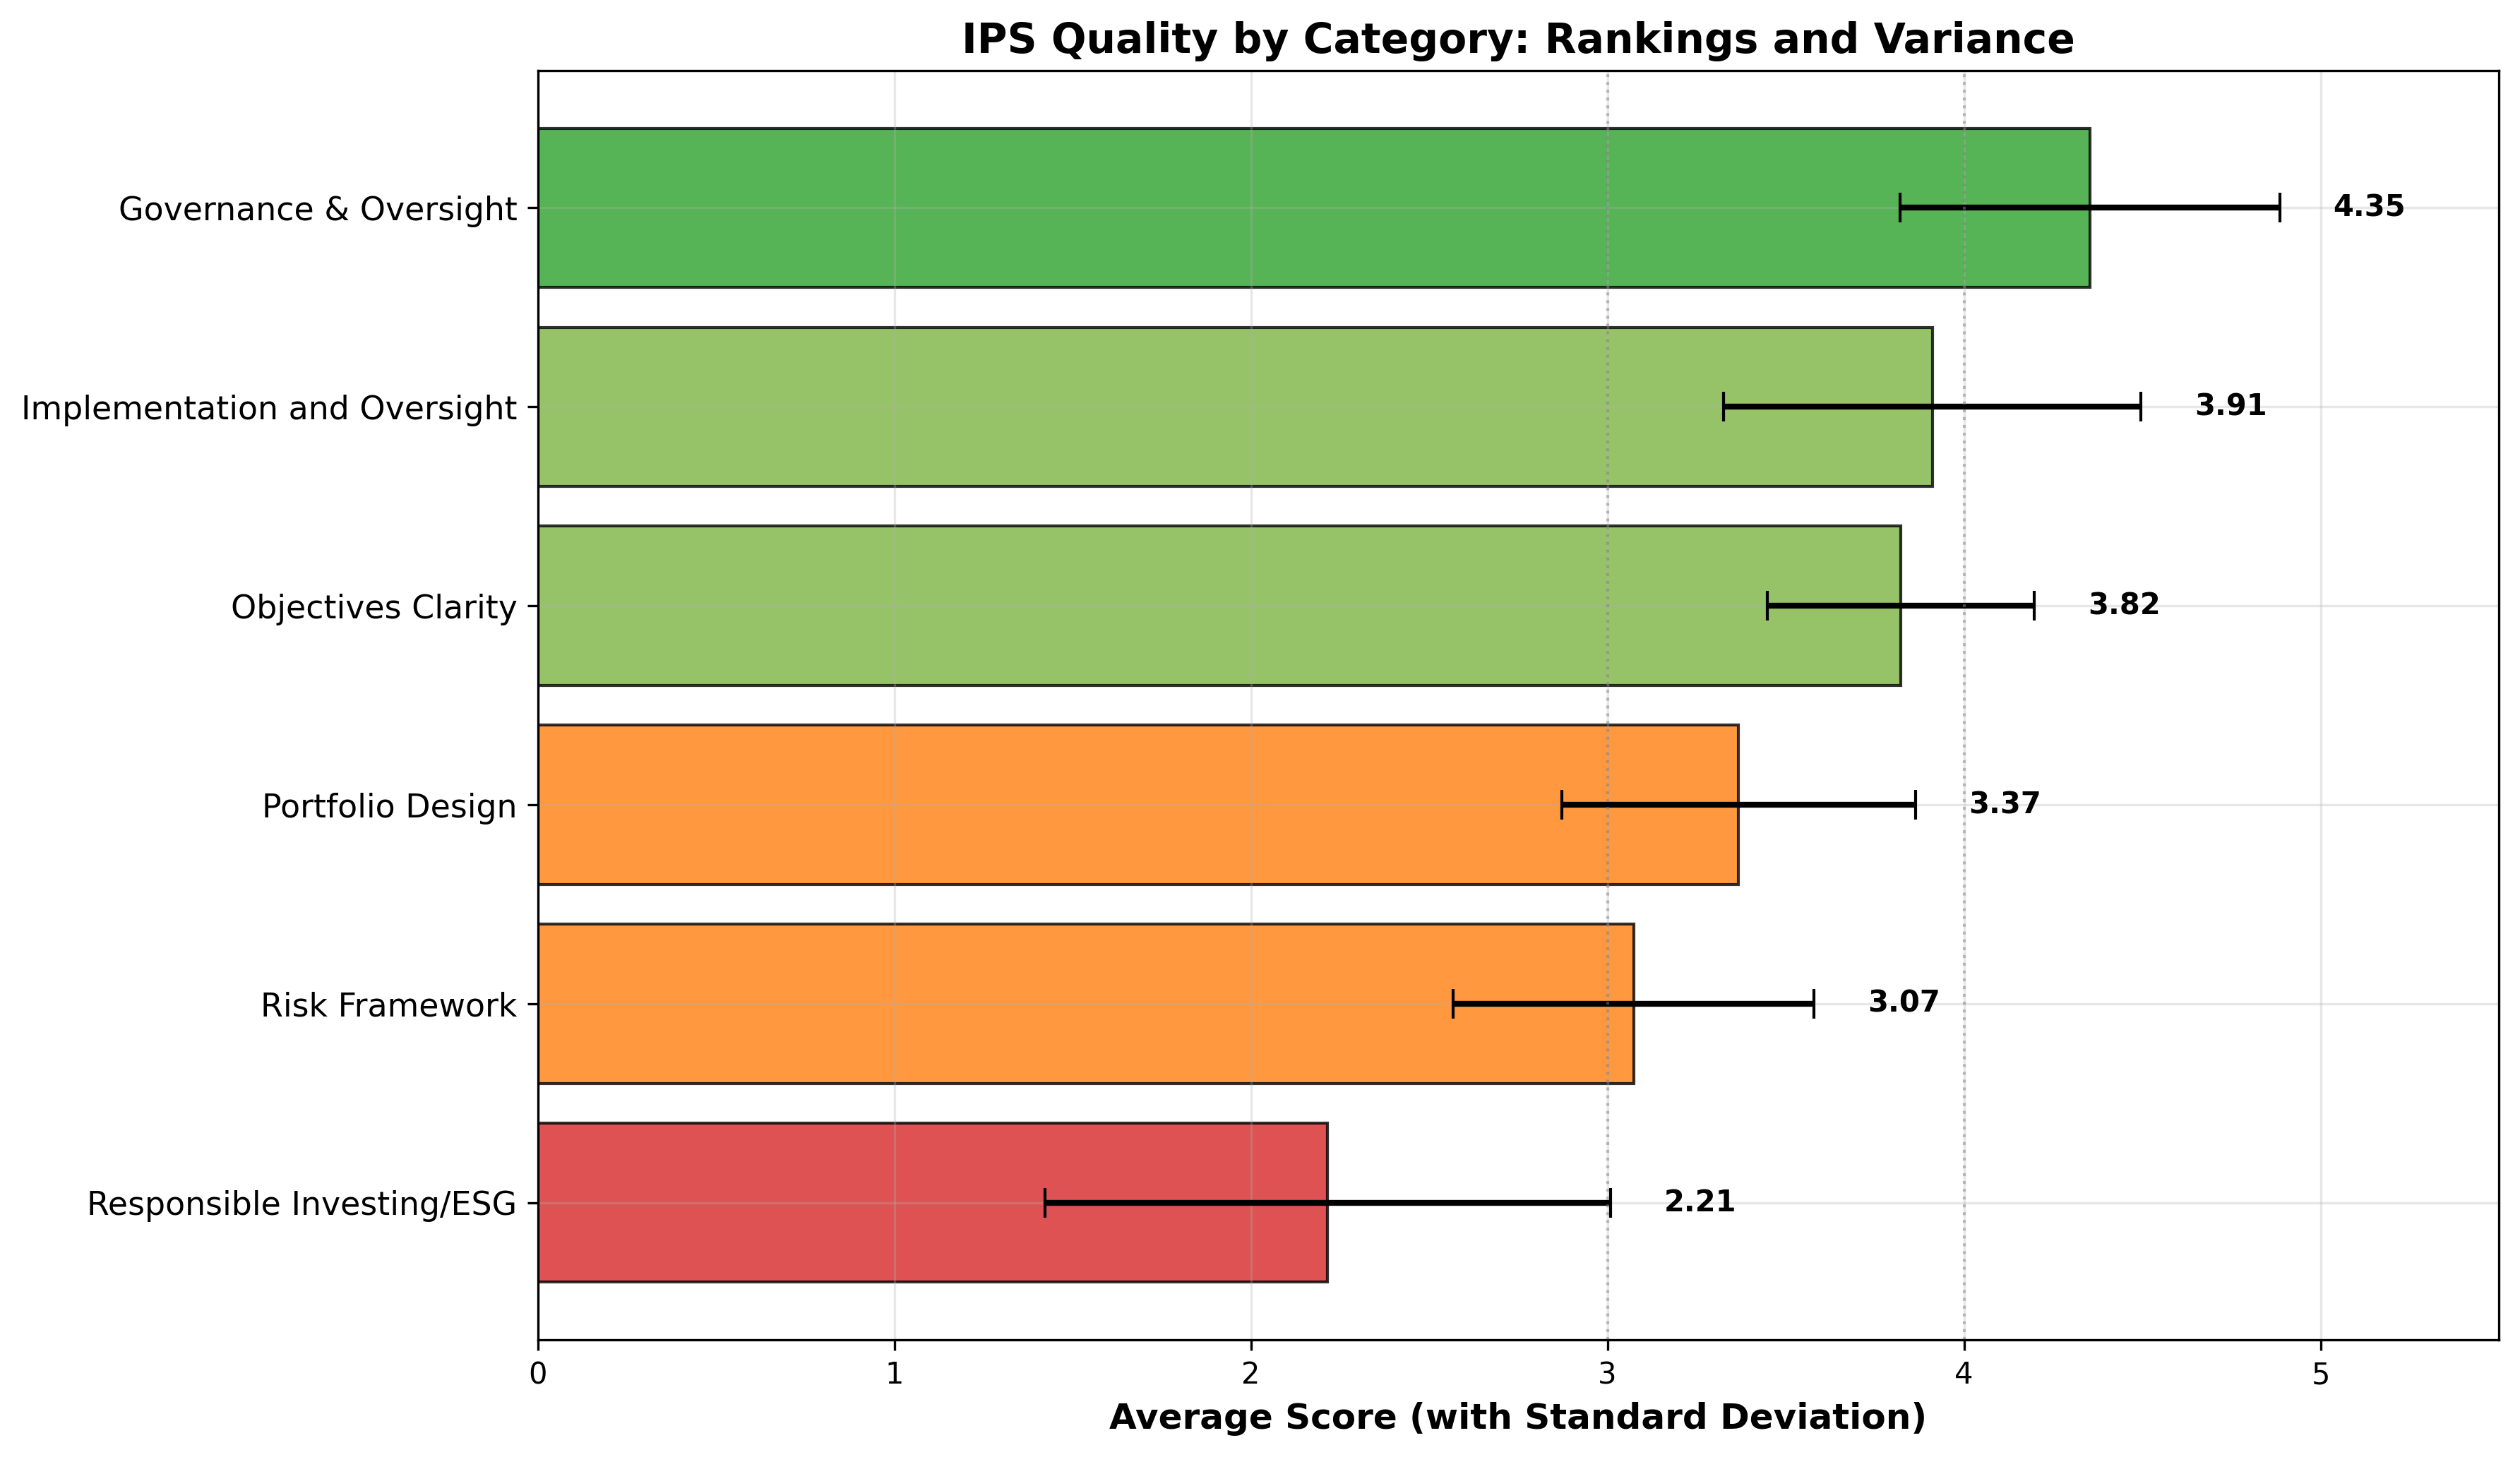
The bar chart ranks the categories with standard-deviation error bars. The strengths (Governance & Oversight, Implementation and Oversight) and the weaknesses (Risk Framework, Responsible Investing/ESG) are the same in every cut of the data that follows.
Figure 2: Category Performance Radar Chart
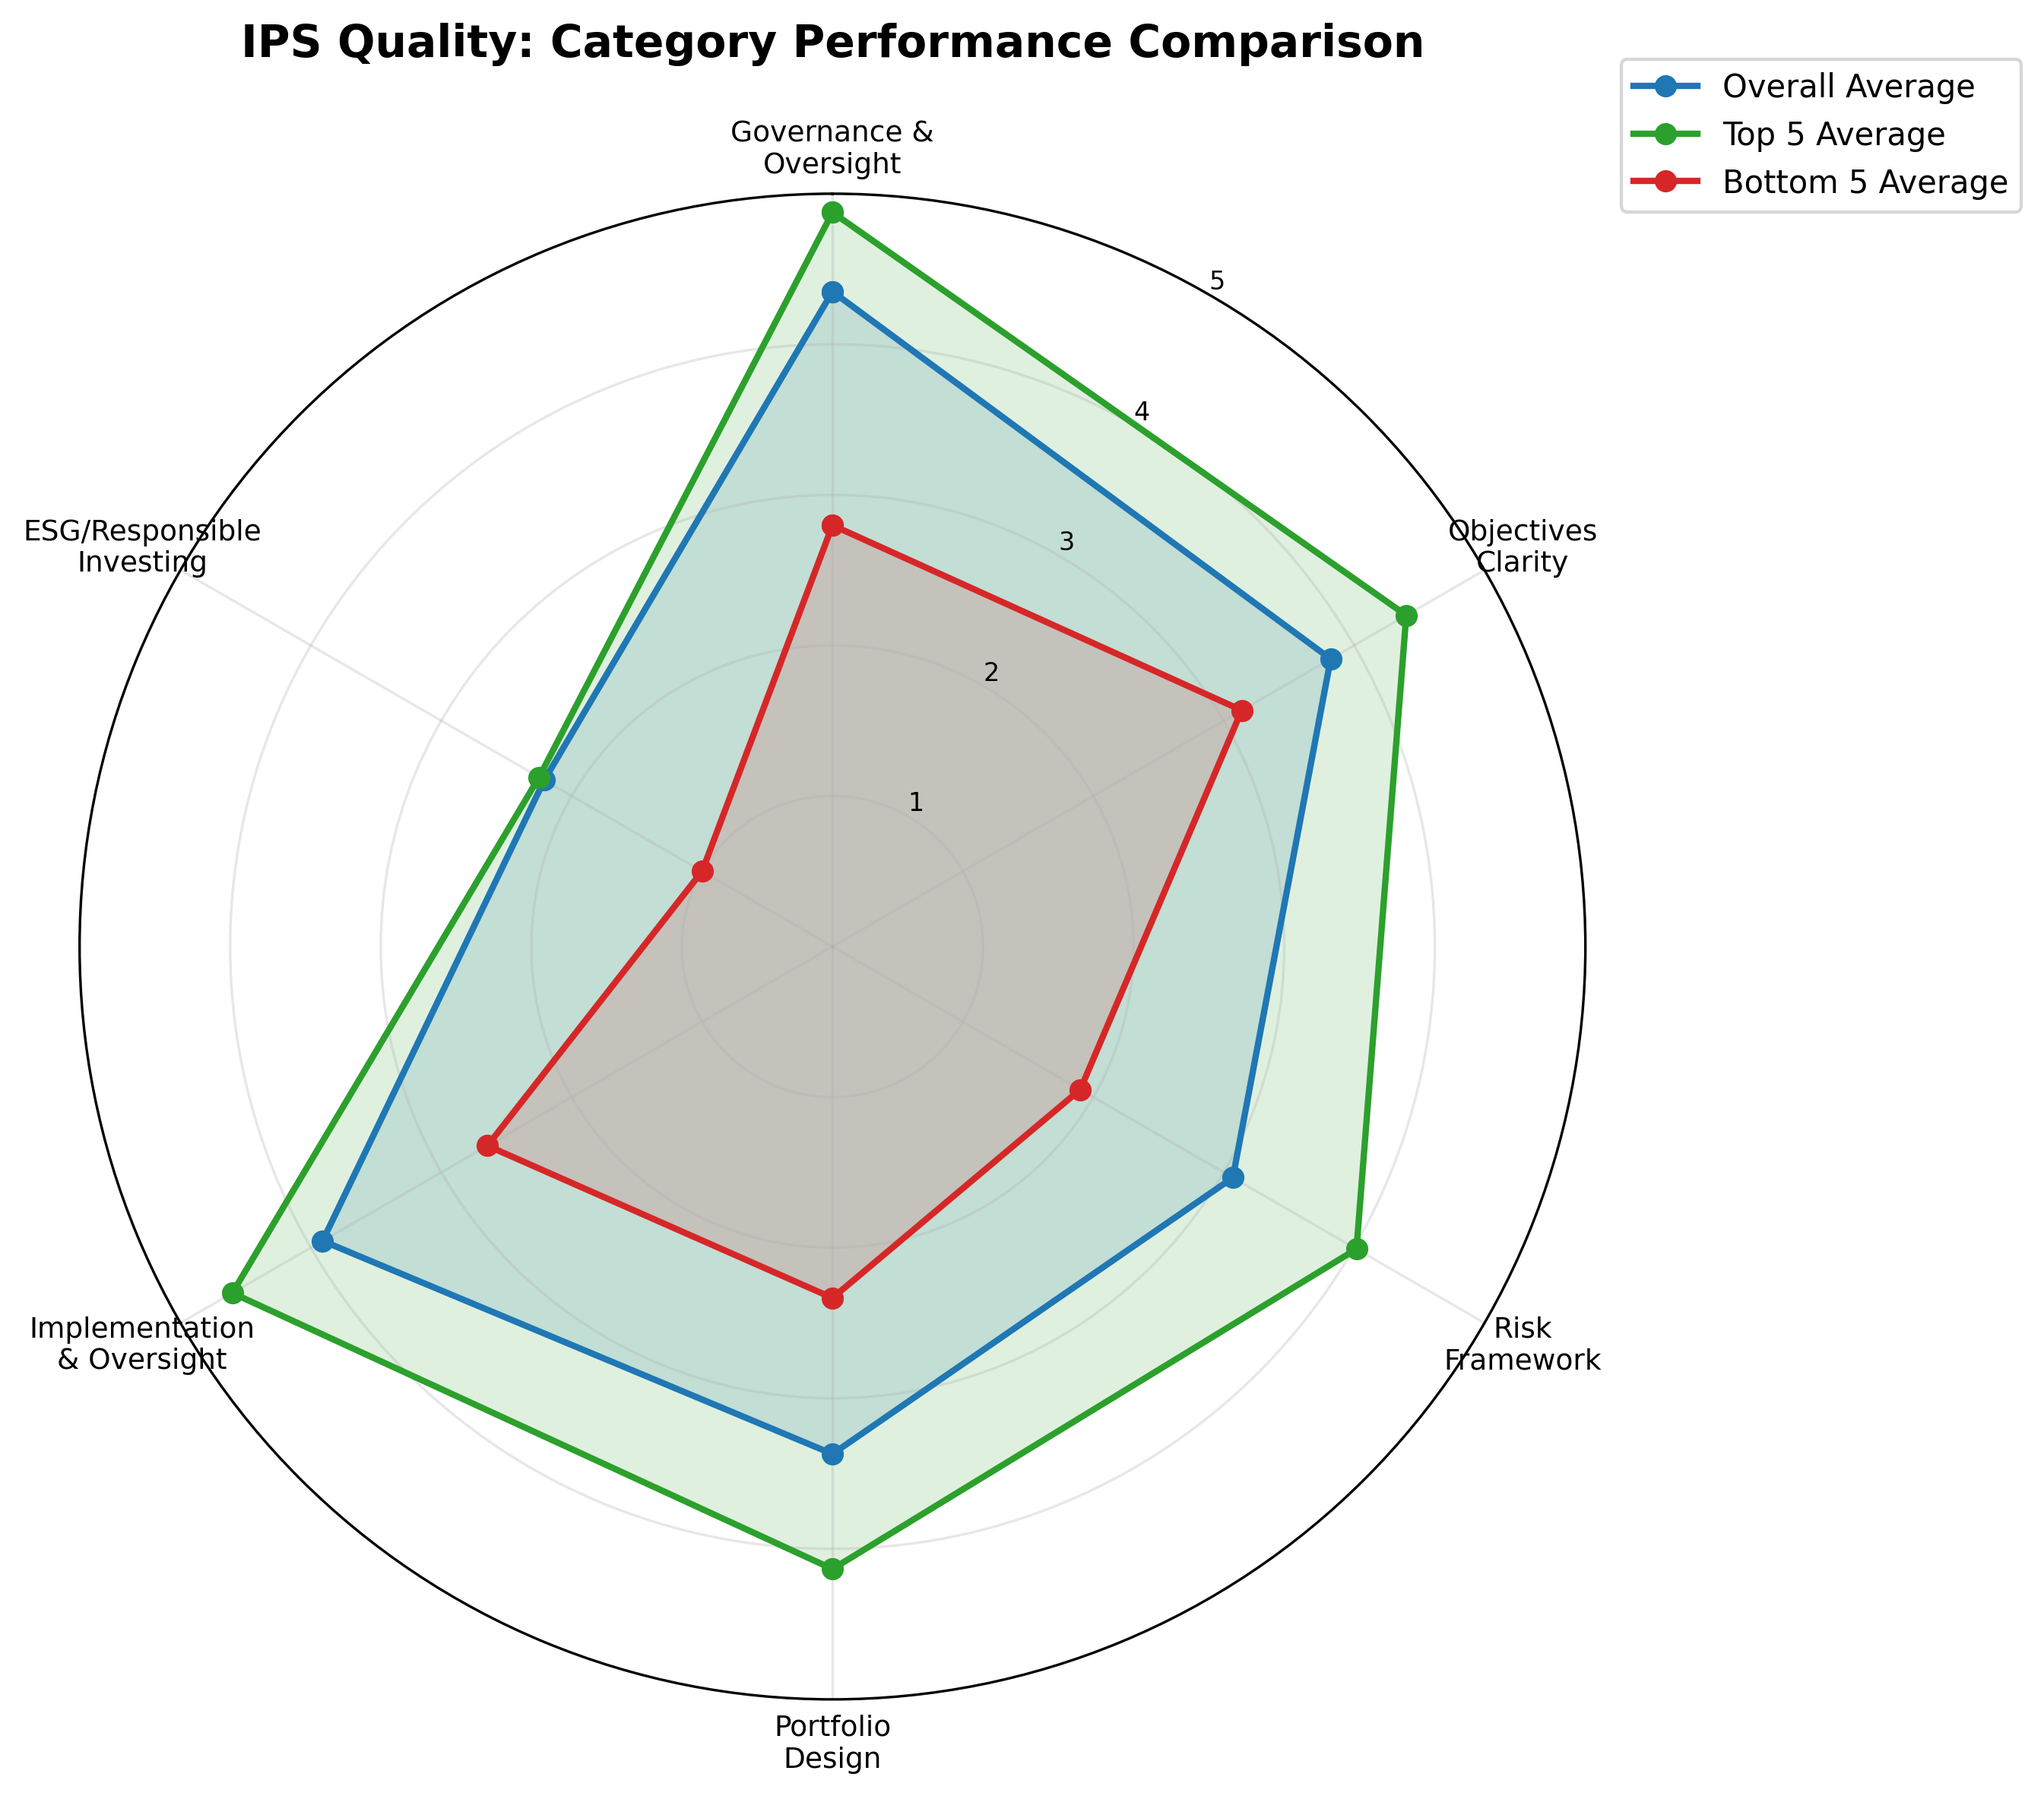
The radar chart overlays the sample mean, the five strongest documents and the five weakest across the six categories. The two outlines have the same shape: the weak documents are weak everywhere, not in one place.
3.3 The Four Quality Lenses
The same scores, decomposed by the lens the judge applied within every domain, locate the weakness precisely (Table 3). Consistency / Structure is the strongest lens at 4.0: documents are, on average, internally consistent and organised. Quantification / Enforceability is the weakest at 3.0, a full point lower. Plans describe their policies; far fewer state them in terms specific enough to bind a decision - a numeric limit, a named body that monitors it, a consequence when it is breached. This is the central finding of the assessment, and every weakness reported below is a form of it.
Table 3: Mean score by quality lens, all applicable domain-lenses
| Quality lens | Mean | Domain-lenses scored |
|---|---|---|
| Consistency / Structure | 4.03 | 1693 |
| Presence / Clarity | 3.66 | 1707 |
| Governance / Process | 3.51 | 1696 |
| Quantification / Enforceability | 2.98 | 1628 |
4. Distribution Analysis
4.1 Score Distribution by Category
Table 4 counts the plans at each score level, category scores rounded to the nearest anchor.
Table 4: Plans by rounded category score
| Category | Mean | Score 5 | Score 4 | Score 3 | Score 2 | Score 1 |
|---|---|---|---|---|---|---|
| Governance & Oversight | 4.35 | 55 | 58 | 8 | 1 | 0 |
| Implementation and Oversight | 3.91 | 14 | 85 | 20 | 3 | 0 |
| Objectives Clarity | 3.82 | 2 | 99 | 21 | 0 | 0 |
| Portfolio Design | 3.37 | 0 | 59 | 57 | 5 | 1 |
| Risk Framework | 3.07 | 0 | 26 | 81 | 15 | 0 |
| Responsible Investing/ESG | 2.21 | 1 | 10 | 17 | 78 | 15 |
4.2 Performance Tiers
26 plans (21%) reach the Strong tier, an overall score of 4.0 or above. 57 (47%) sit between 3.5 and 4.0, and 39 (32%) fall below 3.5 (Table 5). The judge's anchors are demanding: a document reaches the top tier only when its core provisions are quantified and enforceable, not merely present.
Table 5: Plans by performance tier
| Tier | Score band | Count | Share | Mean overall |
|---|---|---|---|---|
| Strong | 4.0 and above | 26 | 21% | 4.16 |
| Middle | 3.5 to 3.99 | 57 | 47% | 3.75 |
| Lower | below 3.5 | 39 | 32% | 3.18 |
Figure 3: Overall Score Distribution
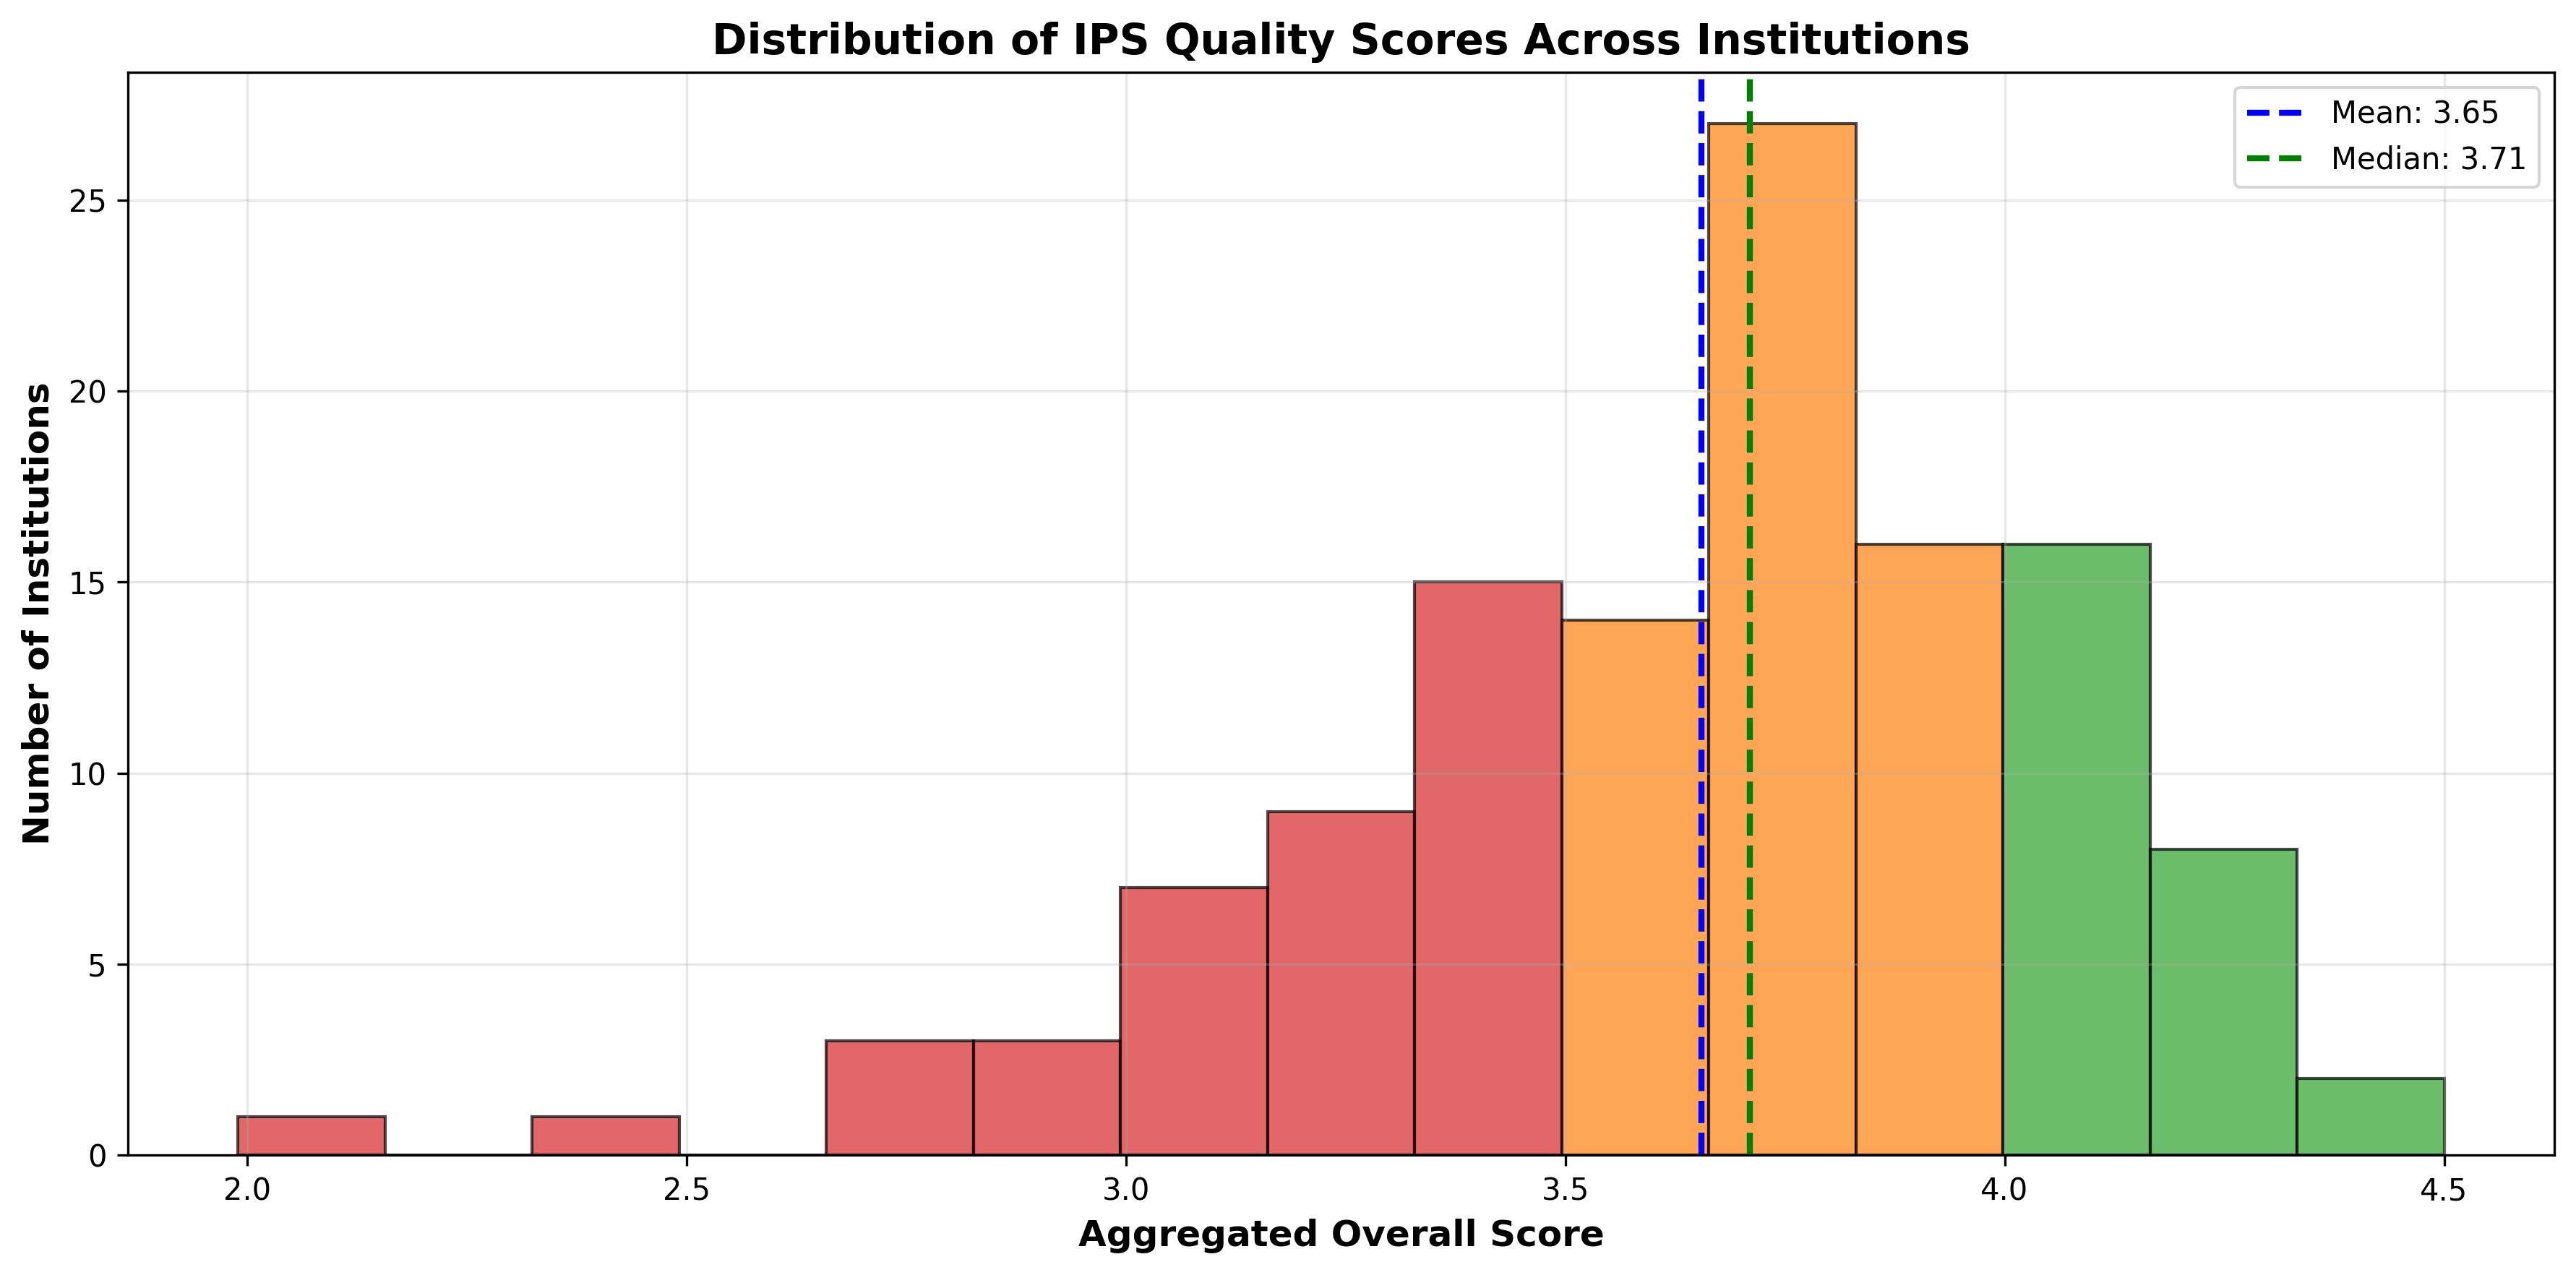
The histogram shows the overall scores with the tiers colour-coded. Two thirds of the plans lie within one standard deviation of the mean, between about 3.2 and 4.1.
Figure 4: Category Score Distributions (Box Plots)
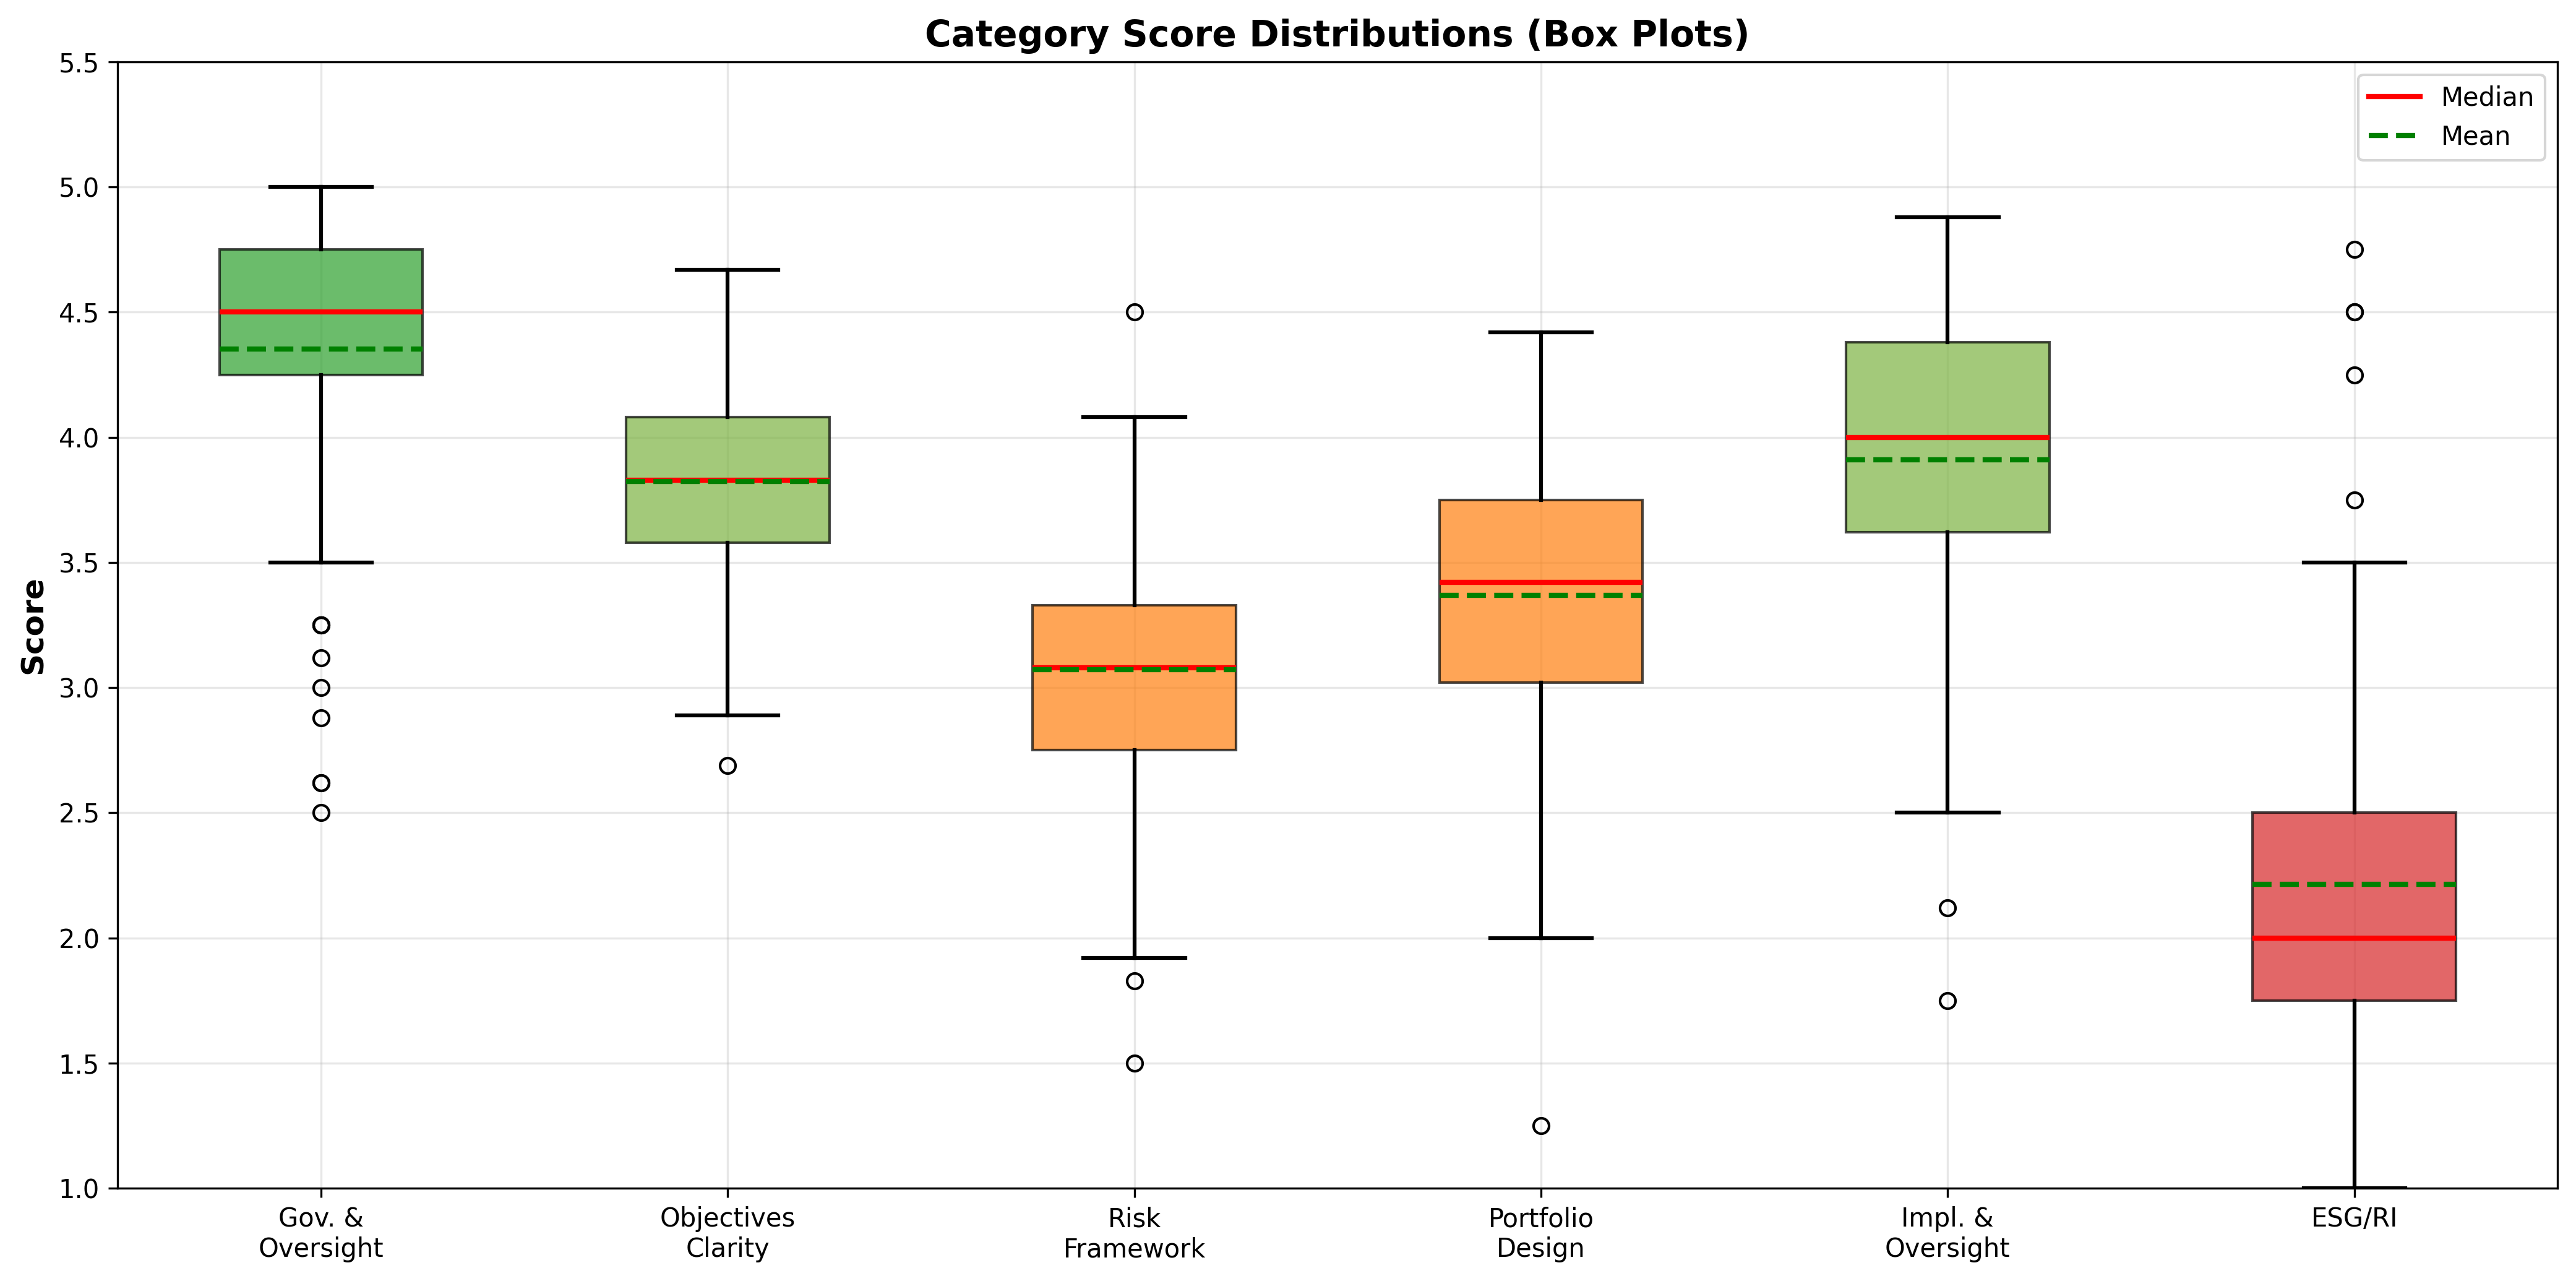
The box plots show each category's median, mean, quartiles and outliers. Governance & Oversight is tight and high; Responsible Investing/ESG is the widest, running from documents that say nothing to a handful that treat it as a policy in its own right.
5. Institutional Rankings
5.1 Top Performers
The ten highest-scoring documents, with the category in which each is strongest:
| Plan | Overall |
|---|---|
| Plan 39 | 4.50 |
| Plan 117 | 4.44 |
| Plan 137 | 4.33 |
| Plan 113 | 4.29 |
| Plan 58 | 4.27 |
| Plan 16 | 4.25 |
| Plan 76 | 4.25 |
| Plan 109 | 4.23 |
| Plan 136 | 4.21 |
| Plan 150 | 4.19 |
5.2 Pattern Analysis: What the Strongest Documents Share
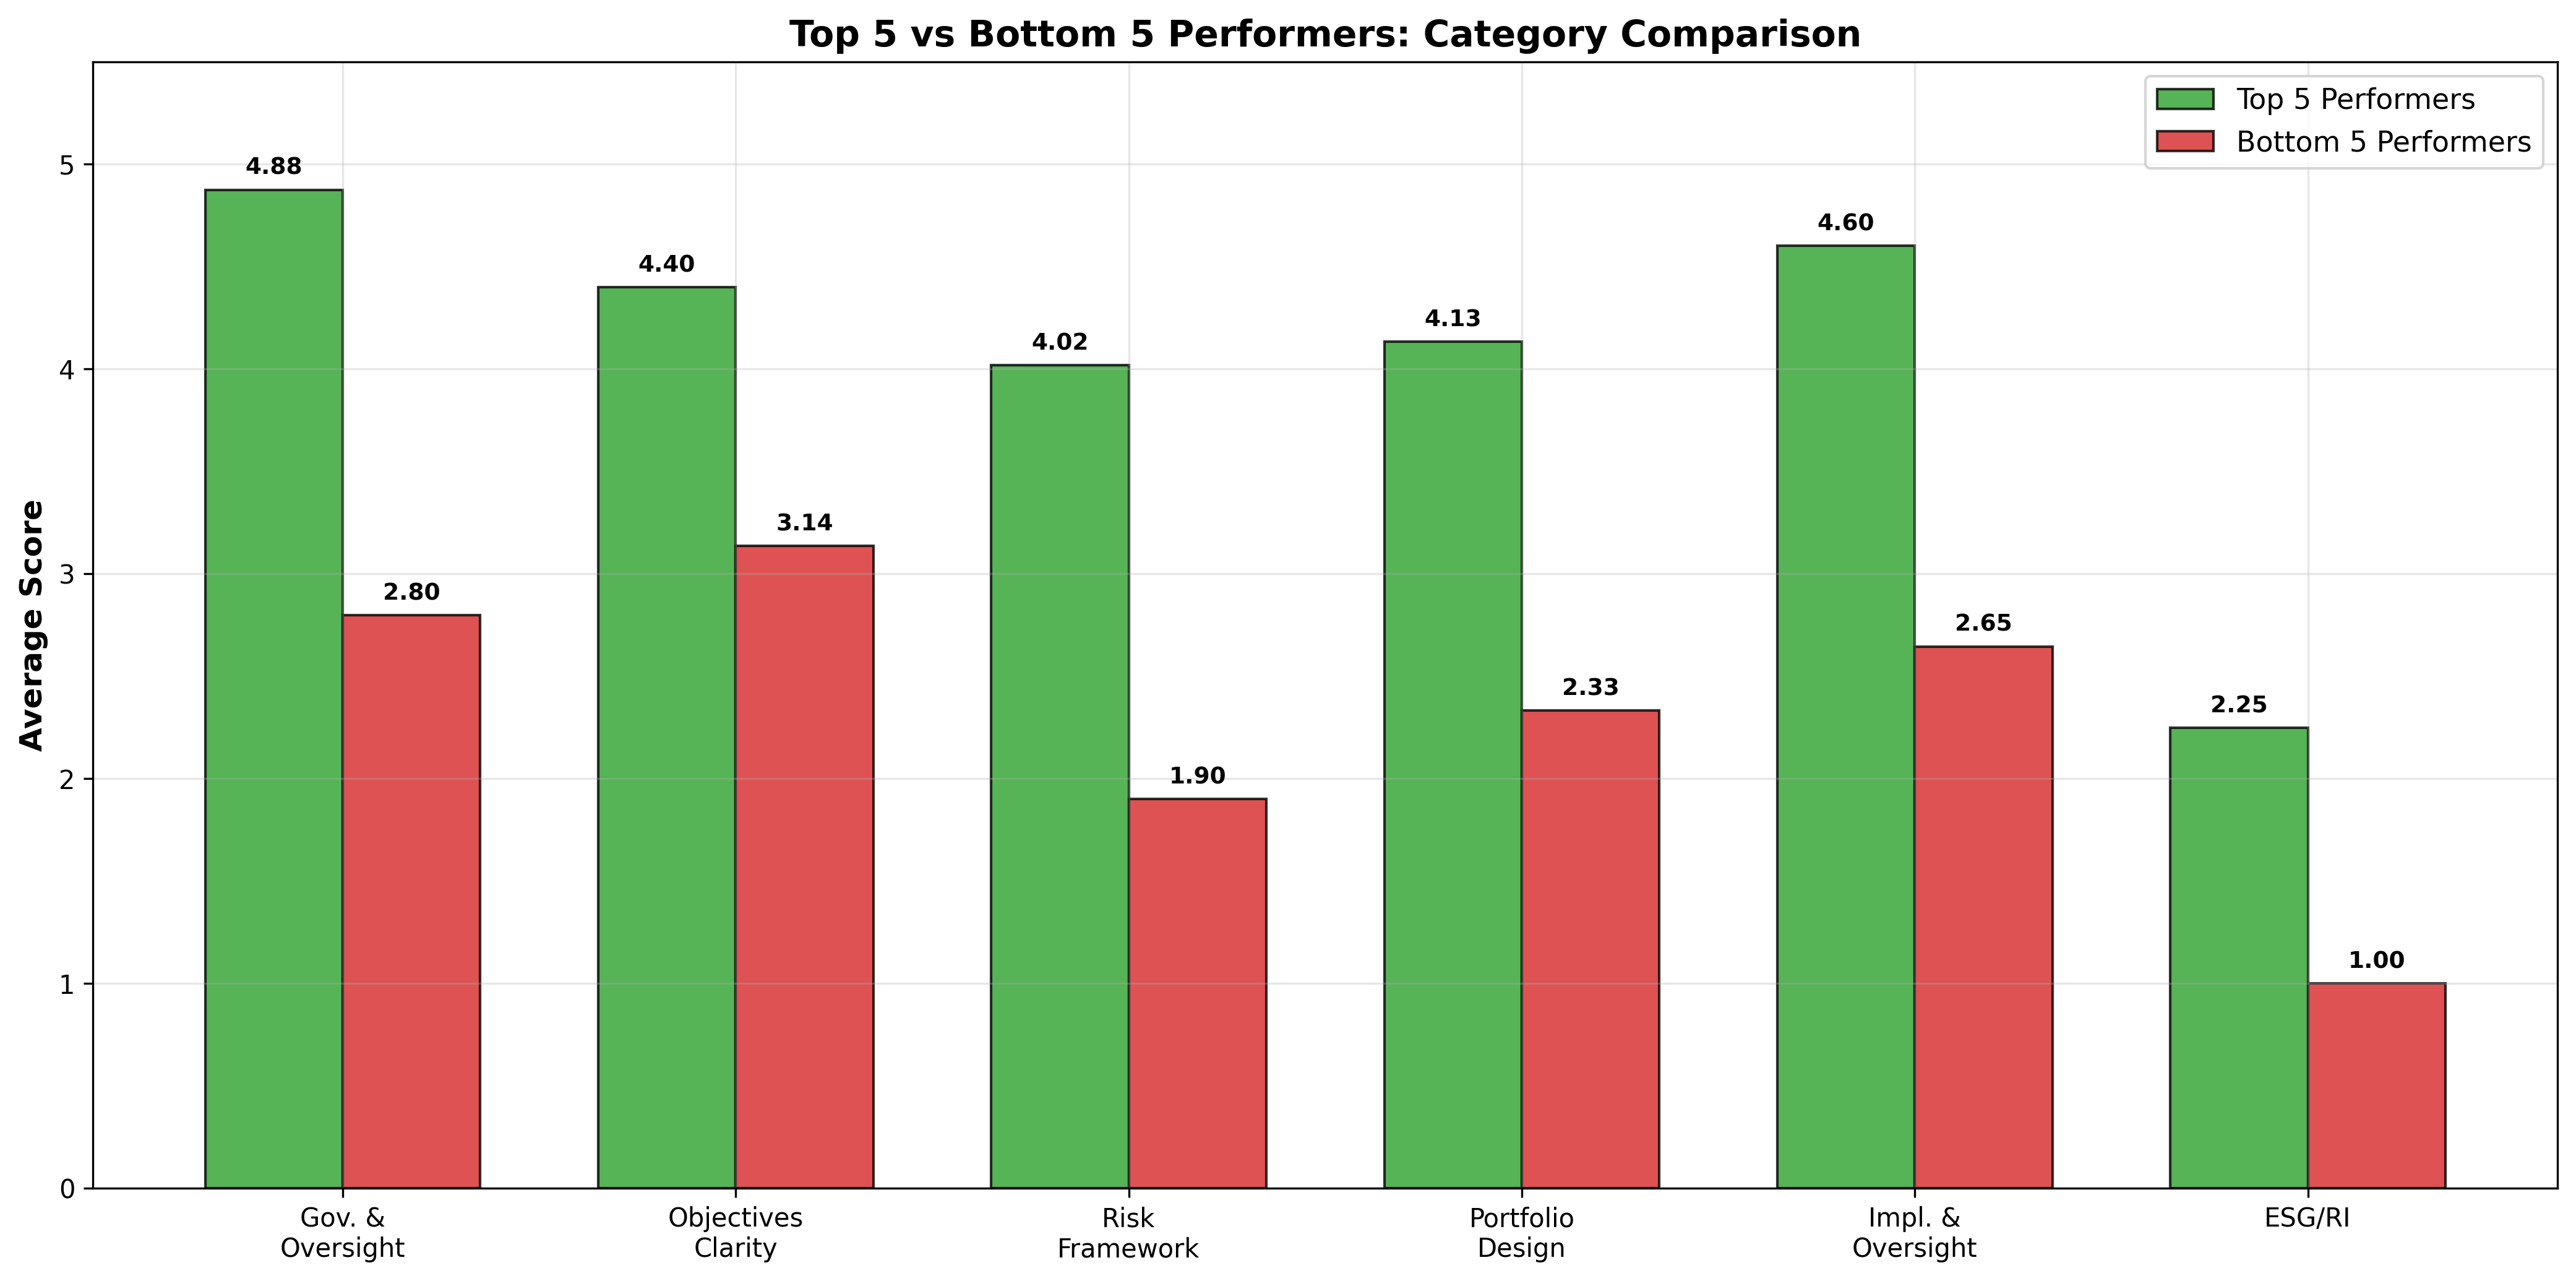
Table 6 sets the mean category score of the five strongest documents beside that of the five weakest.
Table 6: Mean category score, top five versus bottom five plans
| Category | Top five | Bottom five | Gap |
|---|---|---|---|
| Risk Framework | 4.02 | 1.90 | 2.12 |
| Governance & Oversight | 4.88 | 2.80 | 2.08 |
| Implementation and Oversight | 4.60 | 2.65 | 1.96 |
| Portfolio Design | 4.13 | 2.33 | 1.80 |
| Objectives Clarity | 4.40 | 3.14 | 1.26 |
| Responsible Investing/ESG | 2.25 | 1.00 | 1.25 |
The gap is widest in Risk Framework, where the top five average 4.0 against 1.9 for the bottom five. It is narrowest in Responsible Investing/ESG, which is weak in both groups: the strongest documents in the sample are not, in the main, the ones that have engaged with ESG. What they share is depth of enforceability in the core governance and portfolio domains - explicit asset-class targets and ranges, numeric risk limits with a named monitoring body, specific rebalancing triggers, defined review cadences.
Notable finding: Three of the ten highest-scoring plans come from a single state. Enforceable, decision-binding policy language appears to cluster among one plan that share drafting standards, advisers or a statutory framework.
Figure 5: Top vs Bottom Performers by Category
5.3 Institutions Requiring Significant Improvement
The five lowest-scoring documents, with the core category in which each is weakest (ESG, optional and weak in all five, is left out of the comparison):
| Plan | Overall |
|---|---|
| Plan 151 | 2.78 |
| Plan 88 | 2.77 |
| Plan 146 | 2.71 |
| Plan 156 | 2.49 |
| Plan 78 | 1.99 |
6. Areas of Strength
6.1 Governance & Oversight
Table: Governance & Oversight
| Mean | Median | Min | Max | Plans at 4.0 or above | Plans at 2.0 or below |
|---|---|---|---|---|---|
| 4.35 | 4.50 | 2.50 | 5.00 | 100 (82%) | 0 (0%) |
Public pension plans document who decides what. Board authority, delegation to staff and consultants, the reporting cycle and the review cadence are the best-specified parts of almost every document, and the category is the only one in which most plans reach the Strong anchor.
6.2 Implementation and Oversight
Table: Implementation and Oversight
| Mean | Median | Min | Max | Plans at 4.0 or above | Plans at 2.0 or below |
|---|---|---|---|---|---|
| 3.91 | 4.00 | 1.75 | 4.88 | 64 (52%) | 1 (1%) |
Manager selection, monitoring and termination, and the benchmarks against which each sleeve is measured, are set out in operational detail by about half the sample, and the category has the second-widest spread: where it is weak, the benchmark is unnamed or the termination decision has no trigger.
7. Areas of Weakness
7.1 Responsible Investing/ESG
Table: Responsible Investing/ESG
| Mean | Median | Min | Max | Plans at 4.0 or above | Plans at 2.0 or below |
|---|---|---|---|---|---|
| 2.21 | 2.00 | 1.00 | 4.75 | 4 (3%) | 62 (51%) |
Critical finding: 62 plans (51%) score 2.0 or below in ESG, meaning the document either says nothing about responsible investment or confines it to proxy voting. At the other end, 4 plans reach 4.0 or above, so a fully specified ESG policy does exist in the sample; it is rare. The category is the widest-spread in the assessment because it runs from absent to well-specified, where every core category runs from weak to strong. ESG is optional in the rubric and never moves the headline score; its weakness is reported, not penalised.
7.2 Risk Framework
Table: Risk Framework
| Mean | Median | Min | Max | Plans at 4.0 or above | Plans at 2.0 or below |
|---|---|---|---|---|---|
| 3.07 | 3.08 | 1.50 | 4.50 | 4 (3%) | 4 (3%) |
Risk tolerance is usually stated in words, rarely in numbers. Few documents give a volatility target, a drawdown or funded-status threshold, or a liquidity buffer with a stress test behind it, and fewer still name who monitors the limit and what happens when it is breached. This is the clearest expression of the enforceability gap in Section 3.3.
7.3 Portfolio Design
Table: Portfolio Design
| Mean | Median | Min | Max | Plans at 4.0 or above | Plans at 2.0 or below |
|---|---|---|---|---|---|
| 3.37 | 3.42 | 1.25 | 4.42 | 11 (9%) | 2 (2%) |
Strategic asset allocation is generally documented, but allowable ranges and the treatment of illiquid drift are often missing. Rebalancing policies omit triggers or authority. The spending and distribution policy is the single most common critical gap in the sample: most documents defer it to the actuarial valuation or the plan statute rather than state the fund's own commitment.
8. Critical Gaps Analysis
65 plans (53%) carry at least one critical gap, a mandatory domain scored at 2 or below, and 101 such gaps are recorded in total. They are not spread evenly.
8.1 Most Common Critical Gaps
| Domain | Plans with a critical gap |
|---|---|
| Spending / Distribution Policy | 58 |
| Liquidity & Cash Flow Management | 22 |
| Rebalancing Policy | 6 |
| Time Horizon & Constraints | 5 |
| Performance Measurement & Benchmarks | 3 |
| Monitoring, Reporting & Review | 3 |
| Investment Objectives | 1 |
| Risk Tolerance & Risk Philosophy | 1 |
| Strategic Asset Allocation | 1 |
| Implementation & Manager Oversight | 1 |
Figure 6: Critical Gaps Frequency
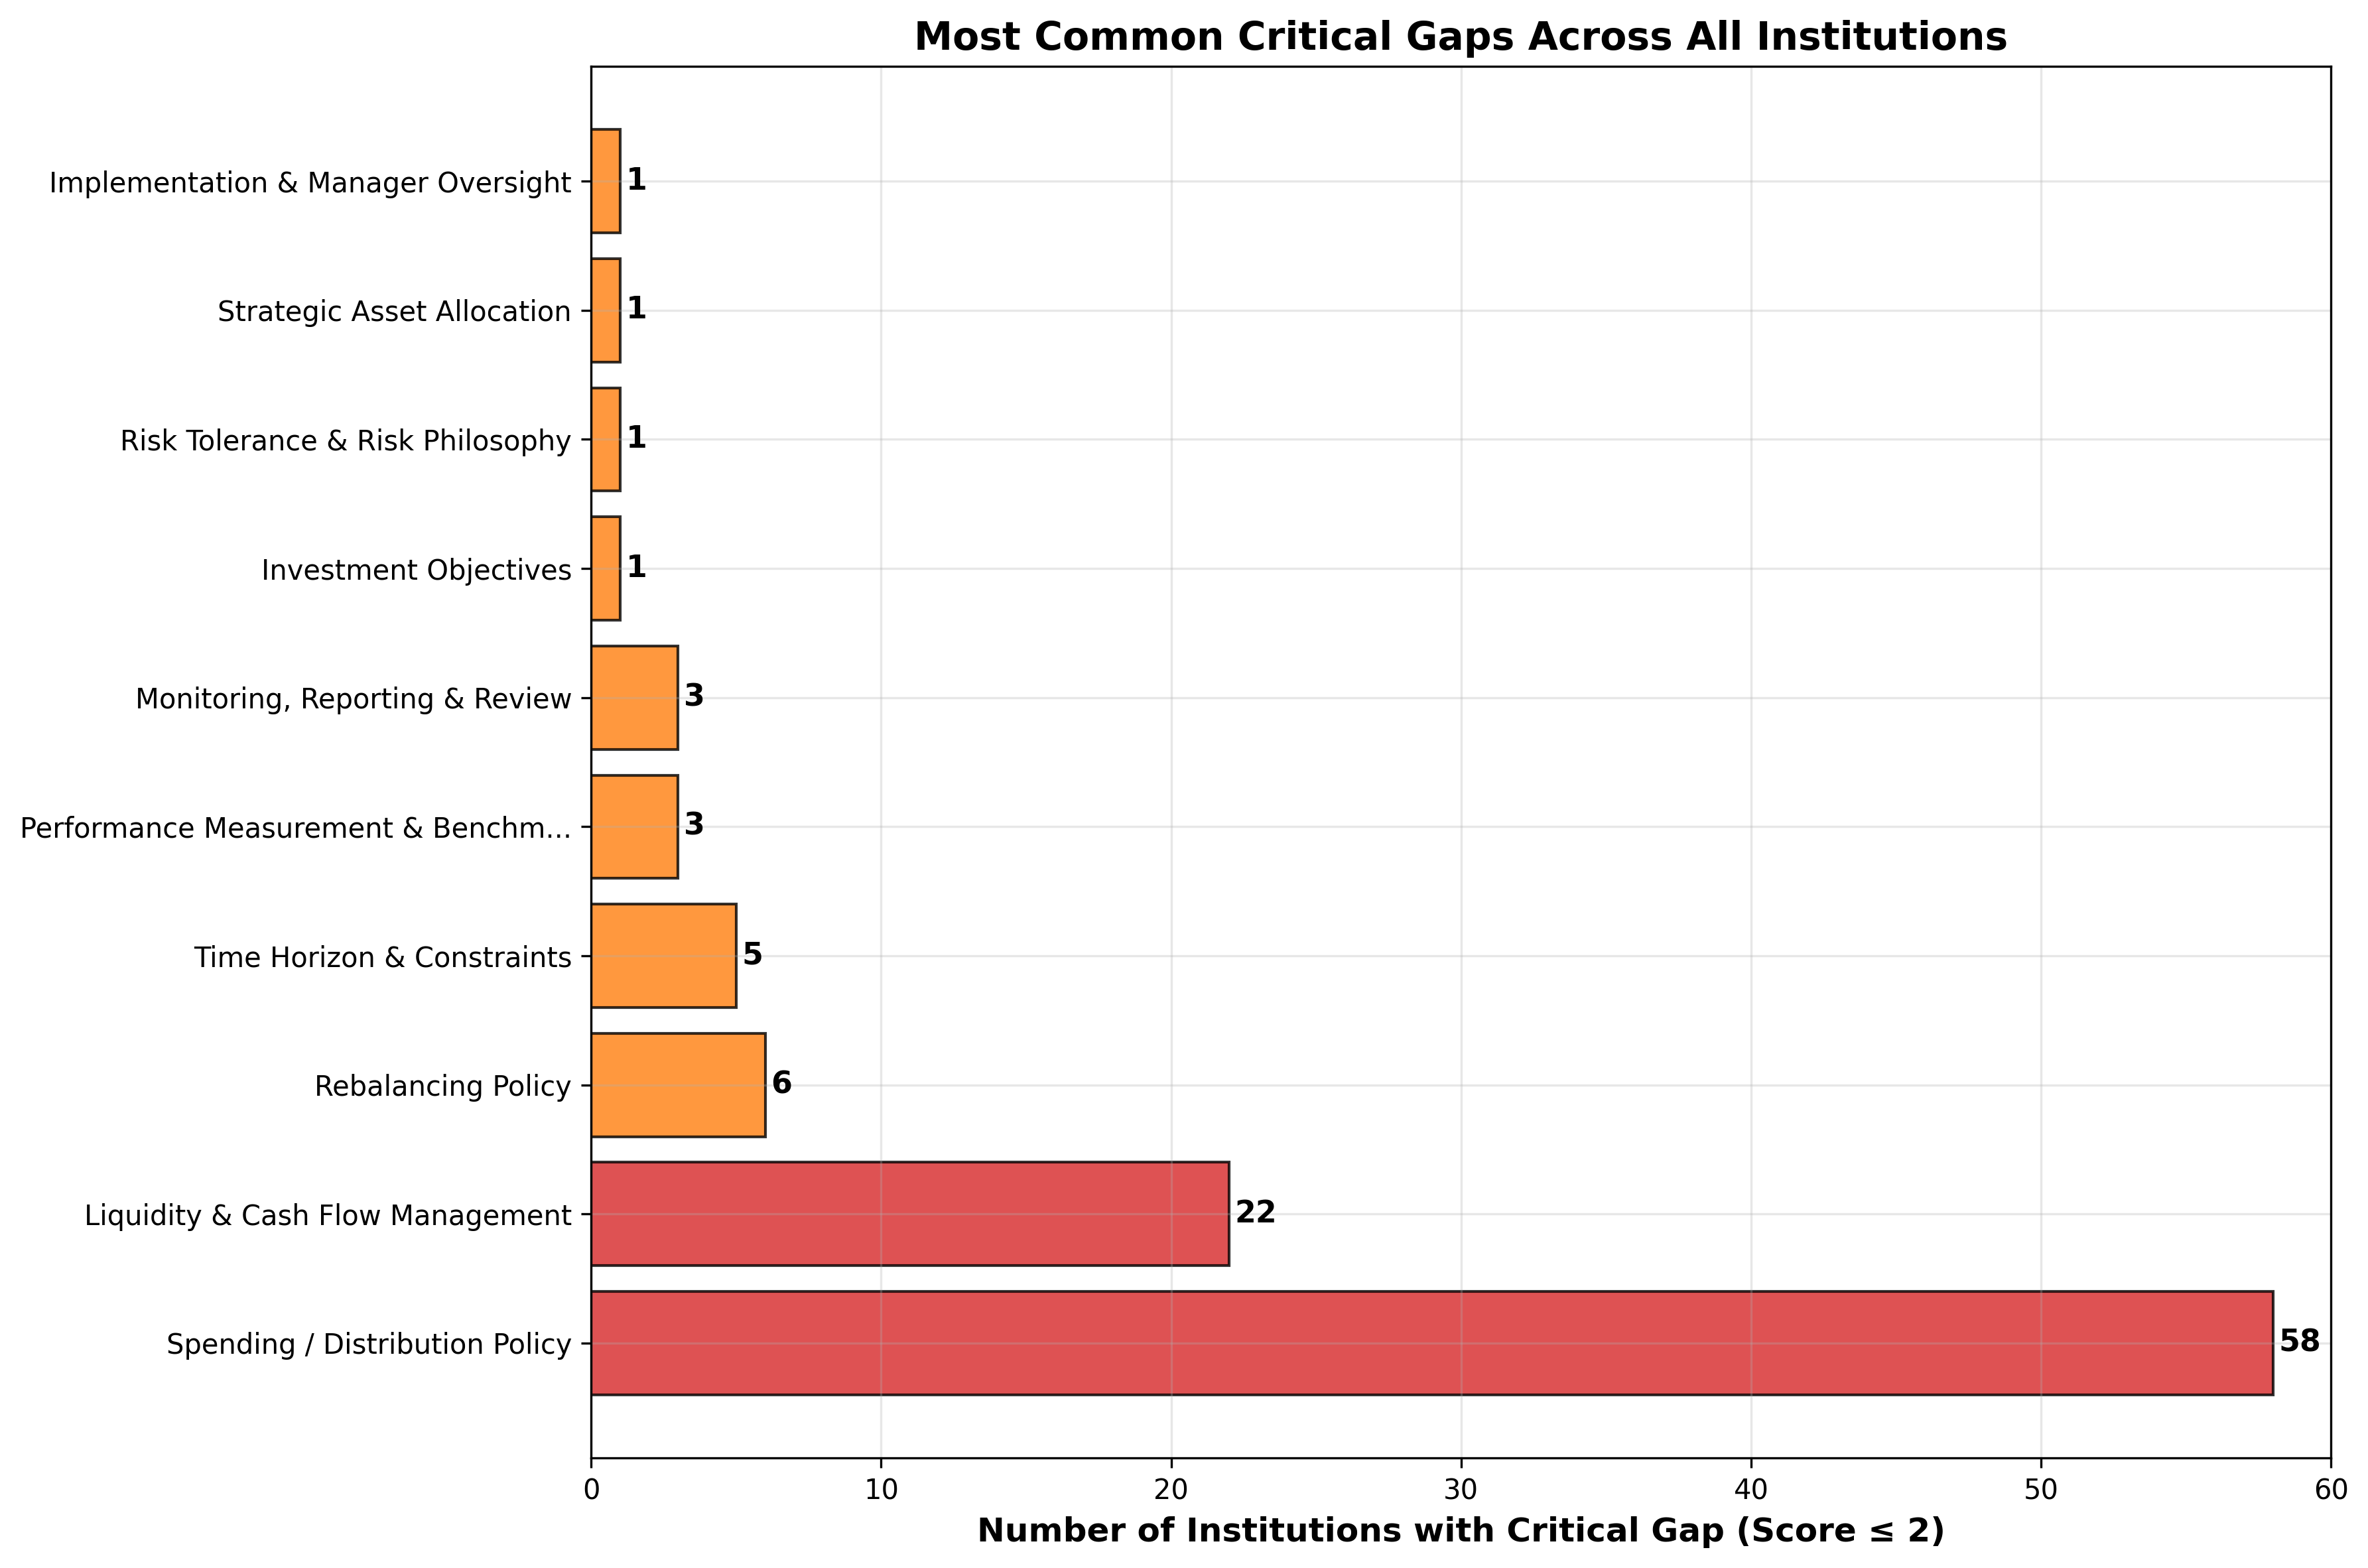
Spending / Distribution Policy is the most frequent critical gap, present in 58 of the 65 plans that have one. The gaps concentrate in exactly the domains that require a quantified, operational commitment: spending and liquidity mechanics, rebalancing triggers, and the horizon and risk-limit provisions that govern them.
8.2 Case Study: The Plan With the Most Critical Gaps
One plan carries more critical gaps than any other document in the sample; the domains are listed below with their scores. Reading them together shows the shape of a weak IPS: the policy is present as a description, absent as a commitment.
| Domain | Score |
|---|---|
| Risk Tolerance & Risk Philosophy | 1.75 |
| Time Horizon & Constraints | 1.75 |
| Liquidity & Cash Flow Management | 1.00 |
| Spending / Distribution Policy | 1.00 |
| Strategic Asset Allocation | 1.50 |
| Rebalancing Policy | 1.25 |
| Performance Measurement & Benchmarks | 1.75 |
| Implementation & Manager Oversight | 1.75 |
Focus Area: Risk Tolerance & Risk Philosophy
Strong policy language in this domain includes:
- Clear triggers or thresholds for action
- Explicit authority and accountability for the decision
- A defined review cadence and documentation requirement
- Procedures for exceptions and for extreme market conditions
Each of these turns a description into a decision rule. That is the difference the judge measures, and it is what separates the documents in Section 5.1 from those in Section 5.3.
Figure 7a: Top 20 Institution x Category Performance Heatmap
Figure omitted from the public edition.
The heatmap shows the twenty highest-scoring plans across the six categories.
Figure 7b: Bottom 20 Institution x Category Performance Heatmap
Figure omitted from the public edition.
The heatmap shows the twenty lowest-scoring plans across the six categories.
9. Category-Specific Insights
9.1 Governance & Oversight
Table: Governance & Oversight
| Mean | Median | Min | Max | Plans at 4.0 or above | Plans at 2.0 or below |
|---|---|---|---|---|---|
| 4.35 | 4.50 | 2.50 | 5.00 | 100 (82%) | 0 (0%) |
The strongest category. Board structure, delegated authority and the monitoring cycle are set out clearly in most documents; the few weak scores come from policies that describe the board's role without saying what it decides, or that set no review cadence at all.
9.2 Objectives Clarity
Table: Objectives Clarity
| Mean | Median | Min | Max | Plans at 4.0 or above | Plans at 2.0 or below |
|---|---|---|---|---|---|
| 3.82 | 3.83 | 2.69 | 4.67 | 43 (35%) | 0 (0%) |
Near-universal competence. Purpose, scope and objectives are stated in nearly every document. Scores fall where the return objective is left qualitative, or the philosophy does not connect to the allocation that follows.
9.3 Risk Framework
Table: Risk Framework
| Mean | Median | Min | Max | Plans at 4.0 or above | Plans at 2.0 or below |
|---|---|---|---|---|---|
| 3.07 | 3.08 | 1.50 | 4.50 | 4 (3%) | 4 (3%) |
A gap between qualitative statements and quantified tolerance. The strongest documents give a volatility or tracking-error target, a drawdown or funded-status trigger, and a liquidity buffer with a stress test behind it; most give a paragraph of intent.
9.4 Portfolio Design
Table: Portfolio Design
| Mean | Median | Min | Max | Plans at 4.0 or above | Plans at 2.0 or below |
|---|---|---|---|---|---|
| 3.37 | 3.42 | 1.25 | 4.42 | 11 (9%) | 2 (2%) |
Targets are usually documented; ranges, rebalancing triggers and the treatment of illiquid drift less so. The spending and distribution policy, the most common critical gap, is typically deferred to documents outside the IPS.
9.5 Implementation and Oversight
Table: Implementation and Oversight
| Mean | Median | Min | Max | Plans at 4.0 or above | Plans at 2.0 or below |
|---|---|---|---|---|---|
| 3.91 | 4.00 | 1.75 | 4.88 | 64 (52%) | 1 (1%) |
About half the sample sets out manager selection, monitoring and termination, and sleeve-level benchmarks, in operational detail. Where the category is weak the benchmark is unnamed, or the termination decision has no stated trigger.
9.6 Responsible Investing/ESG
Table: Responsible Investing/ESG
| Mean | Median | Min | Max | Plans at 4.0 or above | Plans at 2.0 or below |
|---|---|---|---|---|---|
| 2.21 | 2.00 | 1.00 | 4.75 | 4 (3%) | 62 (51%) |
The weakest category and the widest. Half the sample says nothing beyond proxy voting; a handful state an ESG policy with objectives, a stewardship process and reporting, and treat it as a policy in its own right.
10. Implications and Recommendations
10.1 Key Takeaways
-
Governance is documented well. Public pension plans maintain well-structured policies with clear authority and reporting; this is the sector's established strength.
-
Enforceability is the differentiator. What separates the strongest documents from the weakest is not breadth of coverage but the presence of quantified, binding provisions across the core governance and portfolio domains. The quantification lens is a full point below the structure lens.
-
Risk and portfolio mechanics are the operational gap. Risk tolerance, liquidity, spending and rebalancing are the domains where a description most often stands in for a commitment, and where the critical gaps concentrate.
-
ESG is a systematic gap, with proof that it can be closed. 51% of plans score 2.0 or below; the few that reach the Strong anchor show what a specified policy looks like.
-
The spread is wide. About 2.5 points separate the strongest document from the weakest, so the improvement available to most plans is large and the models for it already exist within the sector.
10.2 Recommendations by Priority
High Priority
1. Quantify the risk framework (for plans scoring below 3.5 in Risk Framework)
- State risk tolerance as a numeric limit: volatility, tracking error, drawdown or funded-status threshold
- Name the body that monitors the limit, the frequency, and the action a breach requires
- Set a liquidity buffer and describe the stress test that sizes it
2. State the portfolio mechanics (for plans with a critical gap in Portfolio Design)
- Give every asset class a target and an allowable range, and say how illiquid drift is treated
- Set rebalancing triggers, the authority to act, and the frequency of review
- State the spending and distribution policy in the IPS, even where the statute or valuation governs it
Medium Priority
3. Complete the implementation chapter (for plans scoring below 3.5 in Implementation and Oversight)
- Name a benchmark for every sleeve and the standard for outperformance
- Specify manager selection criteria, the monitoring cycle and termination triggers
4. Formalise ESG integration (for plans scoring below 3.0 in ESG)
- State whether and how ESG risk enters investment decisions, and who is accountable
- Set out the proxy-voting and engagement framework and the reporting on it
- The 4 documents at the Strong anchor in ESG are the models to read
Ongoing
5. Maintain the governance chapter
- Keep a fixed review cycle for the IPS itself, annual or biennial
- Record every change and its rationale
10.3 Best Practices From the Strongest Documents
- Coverage: every mandatory domain is addressed with substantive content
- Quantification: measurable limits and targets stand beside every qualitative statement
- Operational detail: strategy is connected to implementation through stated processes
- Named accountability: each limit has a monitor and each decision has an owner
- Currency: the document shows a review cycle and recent amendment
11. Limitations
11.1 Methodology Constraints
-
Document-based assessment: the scores reflect the written policy, not practice. A plan may run robust processes its IPS does not describe.
-
Model-based scoring: scores are produced by an LLM judge (Section 2.3), not a human panel. The judge is constrained by explicit anchors, a structured schema and evidence checks, but can still misread an atypical document; that is why the scores are validated against an expert and reported with agreement metrics rather than treated as ground truth.
-
Calibration at scale: expert validation uses a single rater with a test-retest ceiling on a stratified sample, not a multi-rater panel over the full universe.
-
Evidence verification is flag-only: cited quotes are checked against the source, but the result is reported rather than enforced, and the matcher under-counts quotes reconstructed from tables.
-
Wrong-document risk: the corpus is gathered from what each sponsor publishes, and some sponsors publish a different instrument in the place of an IPS; a single plan is withheld from scoring for that reason. A document of the wrong kind with a convincing cover page would not be caught automatically.
-
Point-in-time: policies are amended. The assessment captures the published document at the analysis date; the corpus is refreshed monthly.
11.2 Sample Limitations
-
Coverage: the 122 plans are drawn from the two hundred with the most assets, so the findings describe the large-plan sector and may not hold for small plans.
-
Selection: a plan enters the sample only if its sponsor publishes the IPS. Plans that do not publish are absent, and their documents may differ systematically from those that are.
11.3 Rubric Limitations
-
ESG scoring: the rubric may under-score plans whose responsible-investment programme is real but documented outside the IPS.
-
Equal weighting: mandatory domains carry equal weight in the overall score; some may matter more for a given plan type or circumstance.
-
Best-practice drift: the anchors reflect current practice and will need revisiting as it evolves.
12. Conclusion
This assessment of IPS quality across 122 U.S. public pension plans finds a sector with strong governance fundamentals and a wide gap between describing a policy and committing to one. The mean overall score of 3.7 reflects competent documentation; the strongest documents show what a fully specified policy looks like, and they do so within the same constraints every other plan faces.
Key Findings
Strengths: - Governance structures and oversight are well established (4.4 average) - Objectives and philosophy are clearly articulated (3.8 average) - Implementation and manager oversight are set out in operational detail by about half the sample (3.9 average)
Gaps: - Risk frameworks lack quantified limits (3.1 average) - Portfolio mechanics are under-specified, and spending policy is the most common critical gap (3.4 average) - ESG integration is systematically weak (2.2 average) - Across every domain, quantification and enforceability is the weakest lens (3.0 average)
The Path Forward
Closing the gaps identified here is not a documentation exercise. A specified, enforceable IPS:
- Strengthens fiduciary accountability and the plan's legal position
- Keeps decisions consistent across board transitions
- Gives members, sponsors and legislators a transparent standard to hold the plan to
- Sets clear expectations for staff, consultants and managers
- Preserves institutional memory
Future Research Directions
- Longitudinal analysis: the corpus is refreshed monthly; tracking scores through amendments will show whether and how documents improve
- Size and type: whether plan size, type or funding status correlates with documentation quality
- Outcomes: whether documentation quality relates to governance events or investment outcomes
- Peer diffusion: how enforceable language spreads among plans that share advisers or statutes
Final Observations
The spread of about 2.5 points between the strongest and weakest documents demonstrates that excellence is achievable within current constraints. The top performers, strongest in the core governance and portfolio domains, are proven models that other plans can adapt. Plans scoring below 3.5 should prioritise a systematic rewrite around quantified commitments; those in the middle tier can target the weak categories identified here; even the strongest have an unaddressed frontier, most often ESG.
An excellent IPS is both compass and constitution: it guides decisions and binds them. The sector has built the compass. The work that remains is the constitution.
Appendix: Assessment Rubric Summary
Rubric Overview
Rubric ID: ips_rubric_v1_3
Purpose: evaluate the quality, enforceability and governance clarity of Investment Policy Statement documentation. Scores reflect the written policy, not investment skill or outcomes.
Scoring Scale
| Score | Level | Description |
|---|---|---|
| 5 | Best practice | Fully specified, enforceable, peer-aligned |
| 4 | Strong | Clear, operational, minor gaps |
| 3 | Adequate | Basic structure with gaps |
| 2 | Weak | Present but vague or non-operational |
| 1 | Deficient | Missing or purely aspirational |
Assessment Domains (14 scored, 12 of them core)
The rubric defines 15 domains; the 14 that apply to a public pension plan cover 99 fact elements:
- Scope, Purpose & Coverage
- Investment Objectives
- Investment Philosophy - optional
- Risk Tolerance & Risk Philosophy
- Time Horizon & Constraints
- Liquidity & Cash Flow Management
- Spending / Distribution Policy
- Strategic Asset Allocation
- Rebalancing Policy
- Performance Measurement & Benchmarks
- Governance & Decision-Making
- Monitoring, Reporting & Review
- Implementation & Manager Oversight
- Responsible Investment / ESG - optional
Tax Considerations is conditional on an institution type that does not apply to a public pension plan, so it is not scored and its fact elements are not counted above.
Aggregation Method
- Lens scores: the judge scores four quality lenses per domain against the written anchors
- Domain score: the mean of the applicable lens scores
- Overall score: the mean of the 12 core domain scores. Core means mandatory, or conditional and applicable. Investment Philosophy and Responsible Investment / ESG are optional: both are excluded; tax considerations is not applicable and is not scored
- Critical gap: a mandatory domain scored at 2 or below
- Category grouping: the 14 domains are grouped into six categories for reporting; a category score is the mean of its domain scores
Key Assessment Principles
- Document-based: only what the IPS states is evaluated, never the plan's practice
- Enforceability: higher scores require specific, operational, binding language
- Completeness: every required element must be present for a top score
- Governance clarity: roles, authorities and processes must be explicit
- Quantification: numeric targets, thresholds and ranges outrank qualitative statements
End of Report